Inteligência de Dados para Seu Negócio
Otimize seus processos com nossas soluções em business intelligence e automação.
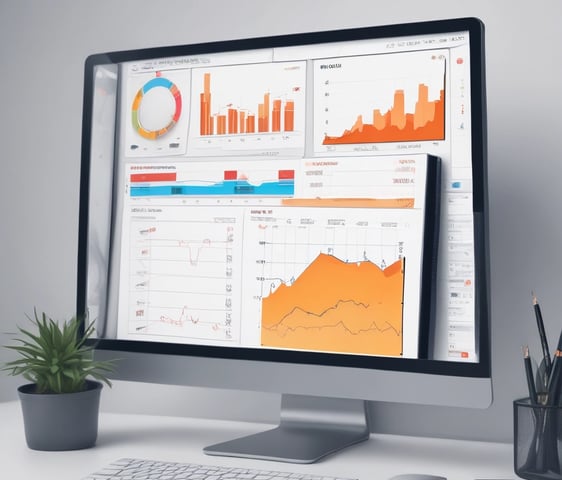
Consultoria em BI
Transforme dados em insights valiosos para decisões.
Monitore seu site com precisão e aumente seus resultados.
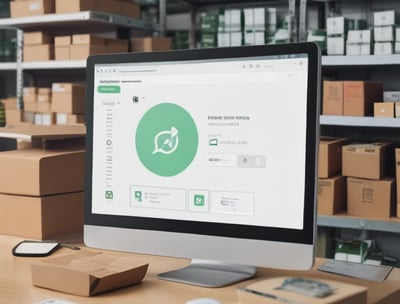
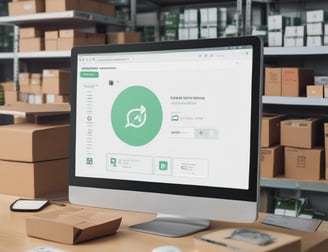
Aumente a eficiência dos fluxos de trabalho com inteligência artificial.
Ferramentas de Tracking
Automações
Inteligência de Dados para Negócios
Na agência de dados, oferecemos consultorias em business intelligence, ferramentas de tracking e automações com IA para otimizar os fluxos de trabalho dos nossos clientes e impulsionar seus resultados.
150+
15
Clientes Satisfeitos
Resultados Comprovados
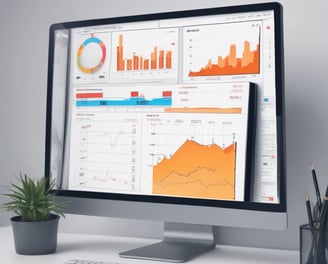
Inteligência de Dados
Oferecemos soluções em business intelligence para otimizar o desempenho do seu negócio.
Consultoria em BI


Ajudamos a transformar dados em insights valiosos para sua empresa crescer.


Tracking de Sites
Implementamos ferramentas de tracking para monitorar e analisar o comportamento dos usuários.
Automação com IA
Soluções para otimizar fluxos de trabalho com inteligência artificial.
Avaliações Clientes
Veja o que nossos clientes dizem sobre nossos serviços de dados.
A agência de dados transformou nosso negócio com insights valiosos e automações eficazes.
João Silva
São Paulo
Os serviços de consultoria em business intelligence foram essenciais para nossa estratégia de crescimento e otimização de processos. Recomendamos a agência de dados para qualquer empresa.
Maria Costa
Rio Janeiro
★★★★★
★★★★★
Projetos Recentes
Nossos projetos otimizam negócios com inteligência de dados eficaz.


Consultoria em BI
Oferecemos consultoria em business intelligence para transformar dados em decisões estratégicas e impulsionar resultados significativos para sua empresa, utilizando as melhores práticas do mercado e ferramentas avançadas.


Automação Inteligente
Implementamos automações com inteligência artificial para otimizar fluxos de trabalho, aumentando a eficiência operacional e permitindo que sua equipe se concentre em tarefas mais estratégicas e de maior valor agregado.